THE ELECTION STARTS IN
00
00
00
00
DAYS
HRS
MIN
SEC
Politics and the Financial Markets
What happens when politics and the financial markets intersect?
It’s that time again. The parties have selected their presidential candidates, and campaigning is in full swing. What does this mean for investment portfolios? Our multipart series takes a nonpartisan look at how politics affect the markets. Come back each week for new data and insight into what happens when these worlds intersect.
Want to know more about how political and seasonal factors may impact the markets? Check out our Political Seasonality Index Financial Strategy fact sheet.
1. PREDICTIONS FOR 2016 USING

POLITICAL SEASONALITY INDEXPOLITICAL SEASONALITY INDEX
10/03/16
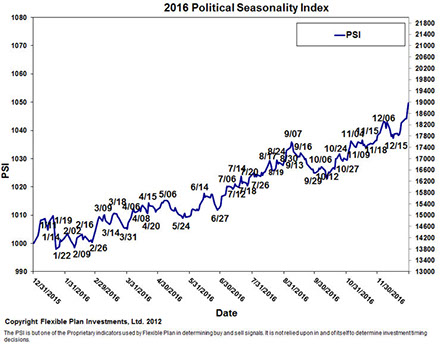
Flexible Plan's Political Seasonality Index (PSI) was first made available to Barron's readers in the 1990s. It seeks to give investors a glimpse as to what the market may have in store for the coming year. Calculating 13 different political and seasonal factors, the Political Seasonality Index's goal is to offer the investor a forewarning of the market's topography a year in advance using data on the stock market’s political and seasonal tendencies.
Our proprietary database of relevant political factors (such as the controlling party in the House, Senate, and White House; and seasonal factors like day of week, month of year, and proximity to holidays) dates back to 1885. Daily changes in the Dow Jones Industrial Index, also dating to 1885, are then used in conjunction with the political and seasonal factors to generate the PSI. It’s not the projected overall direction of the PSI throughout the year that is important (after all the stock market has moved higher on average over the years). Rather, the highs and lows of the PSI form the basis for the buy and sell signals of the strategy for the coming year. Trades are made in a Dow Jones-based index fund or a fund closely resembling the Dow Jones 30 Index.
5. HOW THE PARTY THAT APPOINTS THE
FED CHAIR HAS AFFECTED THE MARKETS10/25/16
In this series we have focused on how the party in control of the presidency, Congress, and combinations of both affects markets. This week we will focus on the fourth branch of government.I know our schools and the Constitution only identify three branches of government: the Executive, the Legislative, and the Judiciary. However, in today’s economic life there has been a fourth, and I’m not speaking of the Press, the so-called fourth estate. No, I’m referring to the Federal Reserve.
The Federal Reserve (now officially referred to as the Board of Governors of the Federal Reserve System) was created in 1913 (the first Board began service in 1914) with a mandate of maintaining full employment and controlling inflation. Increasingly, the Fed, as it is commonly referred to, has had an ever-greater influence on the financial markets. Commentators hang on every utterance of the seven members of its Board, who serve 14 years after appointment by the president and confirmation by the Senate. The chair of the Board is chosen from these members. Congress is forever taking testimony of its Board chair. Stock and bond markets rise and fall on each of its pronouncements.
The inability of the president and Congress to work together has heightened the perceived power of the Fed. As the polls show that gridlock is likely to continue for at least the next two years, and since the chair of the Federal Reserve is appointed by the president for four years subject to Senate confirmation, an inquiry into how the financial markets fare based on which party’s president appoints the chair seems worth pursuing.
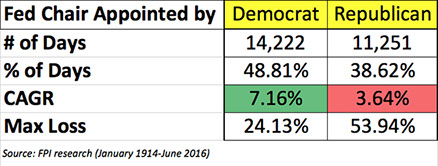
Since 1914, the markets have operated under 15 chairs of the Federal Reserve. Democrat-appointed chairs have presided during 14,222 of the Fed’s trading days (through June 30, 2016), and Republican-appointed chairs have presided during 11,251. During that time, stocks, as represented by the Dow Jones Industrial Average (price only), have done better under Democrat-appointed chairs than under Republican appointees.
2. REPUBLICANS ARE FOR BONDS;
DEMOCRATS ARE FOR STOCKS10/03/16
I can’t tell you how many times and during how many different election cycles I have seen an article featuring that old chestnut that stocks do better under Democratic presidents. Regardless of why that is (timing of national crises, being a beneficiary of previous administration’s policies, freer spending or more liberal monetary policies, etc.), no matter how you slice the data, the results do support that conclusion.For example, since 1900, the stock market—as measured by the only stock index that goes back that far, the Dow Jones Industrial Average—has advanced (price change only, no dividends) 3.51% (CAGR) during Democratic presidential administrations (13,700 days), while only achieving a 1.43% return during Republican presidencies (15,436 days). If we focus instead on the shorter period of 1972 to the present (the time period we will use for most of our studies in this series because data for many asset classes does not go back any further back than that), the disparity remains at 4.6 % to 2.43%.
As I mentioned, these types of comparison in the stock market arena are readily available in the popular press. However, I have not seen any comparisons of how other assets perform during the two types of presidential administrations.
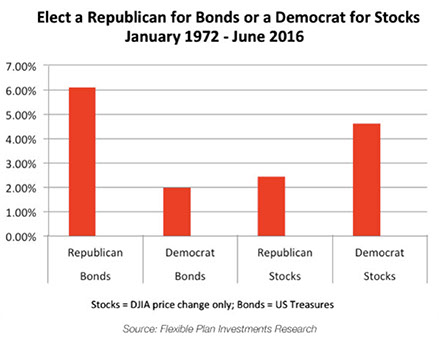
Far larger than the stock market is our bond market. The largest portion of that market is the U.S. Treasury bond market. In contrast to the results in the stock market, Republican administrations have been much better for bond investors. Since 1972, returns for the Treasury bond market during Republican administrations have averaged 6.1 % annually versus 1.98% during Democratic administrations.
As one would expect with such findings, interest rates tend to be higher under Republican administrations. During that same period, the yield of 10-year government bonds has averaged 2.37% during the Democrats’ time in office versus 4.31% with the Republicans.
6. THE SHAPE OF THE MARKET
TO COME—SIMILAR BUT DIFFERENT11/02/16
We’ve seen in past articles in this series that markets are affected differently depending on which party controls Congress, the presidency, and the Federal Reserve. While party control is important, the question of incumbency and the year in the presidential cycle (more on this next week) also have an impact.This week I’m going to pull all of these Election Day issues together (four in all) to see what this leftover Halloween witches’ brew projects for the rest of this year and all of next year. As I reported last quarter, this combination has been especially well-correlated with this year’s daily market action (over 90%).
The data, which stretches back to 1885, is drawn from just a portion of the 13 indicators that are included in our Political Seasonality Index. The yardstick we are measuring against and predicting is the price-only value of the Dow Jones Industrial Average.
The results are shown in the four sets of graphs that follow. The constant in all of the charts is that they use data during the first year of the four-year presidential election cycle and only when there is a non-incumbent election. Each set reflects one of the four combinations of presidential party, Senate party, and House party.
3. CONTROL OF CONGRESS: HOW
HAS IT AFFECTED INVESTMENTS?10/11/16
Despite our nation’s focus each election season on how the political party of presidential administrations has affected the performance of the stock market, there is another side of this political coin. Congress, which is also up for grabs on Election Day, is an equal partner in running the government and determining the course of the economy.Most of the U.S. stock market collapse from October 2007 to March 2009 (15 out of 17 months) was presided over by a Republican president. Yet, Democrats controlled both the House and the Senate during that entire period, as the Dow skidded more than 40%.
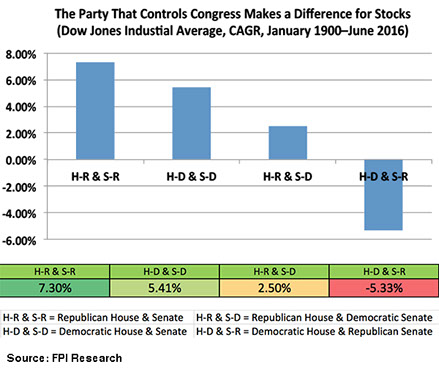
To get a broader perspective, let’s focus on a longer period (since 1900). Stocks have advanced at a non-time-weighted, compound annual growth rate (CAGR) of 5.41% during years (15,505 days) when the Democrats controlled both houses versus 7.3% when the Republicans ruled the two chambers (9,648 days). During periods of mixed rule, the results were, well, mixed. When the Republicans controlled the House but not the Senate (1,411 days), CAGR was 2.5%. When Democrats ruled the House but not the Senate (2,525 days), the results were an average annual loss of a miserable -5.33%.
Other relationships are also worth noting. While the top two ranked types of congressional control since 1900 were when both houses of Congress were controlled by the same party, since 1972 that has changed. During those 44.5 years, while a Republican-dominated Congress still comes out on top with the best returns, the second-best market has now shifted to a Congress with a Democratic-controlled House and a Republican-controlled Senate (on a non-time-weighted return basis). The Democratic-dominated Congress lost second place due to a 53.78% drawdown in the Dow Jones Industrial Average (DJIA) during the periods of their reign.
7. THE SHAPE OF THE MARKET
TO COME—THE ELECTION CYCLE11/08/16
In this series of articles we have seen how different asset class investments are affected by the winner of the presidency, the House, and the Senate, and the party selecting the chair of the Federal Reserve Open Market Committee. This time we are going to peer a little further into the future to see the effect of the presidential party on the stock market’s performance during the four-year election cycle.The four-year election cycle is a well-known market anomaly that has proven amazingly prescient over the years in calling the direction of the stock market. As a general rule, stocks (here represented by the Dow Jones Industrial Average—price only since 1900) have done best during the year before the election year, and then done increasingly poorer during the next three years.
However, combining the election cycle with the party of the occupant of the White House can change this result. When we delve deeper into the statistics, a different cycle emerges.
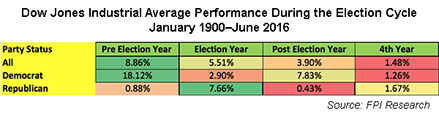
Since 1900, when the president has been a Democrat, the post-election year has been better than the election year for stocks. And the pre-election year remains the best year by a wide margin.
4. CONGRESSIONAL AND PRESIDENTIAL PARTY:
WHAT HAVE BEEN THE BEST COMBINATIONS?10/18/16
In this series we have focused individually on how the party in control of Congress and the presidency affects markets. As it turns out, when the stock market is considered (Dow Jones Industrial Average) and we go all of the way back to 1900, the results have been mixed. Presidential control by the Democrats has been tops for the market, while Congressional control by the Republicans has been best.When we look at the totality of the relationships, some interesting results emerge. As expected, the combination of a Democratic president and a Republican Congress does very well—and perhaps is the most statistically significant as it has occurred in 10% of the cases. But the relatively rare combination (just 3.5% of the cases) of a Democratic president and a mixed Congress (Republicans controlling the House and Democrats controlling the Senate) does best of all. These results are interesting because if the current polling is to be believed, these are the most likely results this year.

Fascinatingly, a sweep for either party (by far the most likely result historically) of all three entities seems to be (1) good for stocks, and (2) just about equal in results, whether you look at non-time-weighted return (CAGR) or maximum loss incurred during such regimes. The worst result from a return perspective (although a pretty rare occurrence) was the combination of a Democratic House and presidency and a Republican Senate. The almost opposite result of a Republican Senate and presidency and a Democratic House generated the greatest drawdown, presumably in the initial years of the Great Depression.
8. NO MORE GRIDLOCK—THE 2017 PSI
MAP OF MARKETS TO COME11/09/16
It has not happened in over 60 years, but on Election Day the voters spoke. The result was a Republican president and Congress, a feat not accomplished at the beginning of a presidential term since a two-year period beginning in January 1953. If history is any guide, this is not an event to be feared. Rather, it is closer to the status quo than one might think. As I reported in this series a few weeks ago, we’ve had an undivided government during more than 57% of the years since 1900.However, we have not often seen such unanimity in recent years. Younger investors may not have much experience with it. They may not realize that the stock market returns during such conditions have on average since 1900 been positive and remarkably similar (at a compounded annual growth rate of about 7%), regardless of which party is in control. And as we discovered in week two of this series, the best stock returns were during a Republican-controlled Congress.
There was a lot of fear as the election approached of how the market would react in the event of a Donald Trump victory. Each improvement in Secretary Clinton’s status was greeted with a stock market rally. And as the poll results were reported, stock market futures were limit down (800 points in the Dow futures in the wee hours of Wednesday morning).
Yet the chart that we published a week and a half ago (below), demonstrated that historically the markets have greeted past Republican sweeps with a gain.
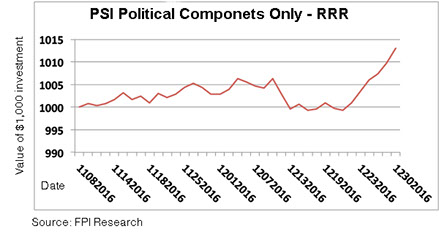
Now that we know who has emerged victorious at the end of a bitter election battle, we can use our Political Seasonality Index methodology to project the turning points of the stock market over the next 14 months.
Receive the next update in our series, Politics and the Financial Markets.
Subscribe to our Market Hotline Newsletter.
STAY INFORMED
Want to learn more? Keep in touch.
Market Hotline
Subscribe to our weekly blog for insight into market conditions and active investment solutions.
WEBINAR / LIVE DEMONSTRATION
Working with Flexible Plan
Join Internal Sales Manager Tony Morales to learn now Flexible Plan Investments can help you build your fee-based business. This is a 20-minute live demonstration followed by a question and answer session.
6-time recognized
Inc. 5000
Fastest-growing
Private Company

PAST PERFORMANCE DOES NOT GUARANTEE FUTURE RESULTS. Inherent in any investment is the potential for loss as well as profit. A list of all recommendations made within the immediately preceding twelve months is available upon written request. Please read Flexible Plan Investments’ Brochure Form ADV Part 2A carefully before investing.